Trace Visualization
Traces are sequences of events or time series of metric values that represent system behavior and performance over time. Visualizing these traces is challenging because of the large number of events (from thousands to millions of events) and the high dimensionality (often hundreds of different event types or performance metrics) of the data.
 |
 |
 |
We are interested in visualization and analysis tools that enable the efficient and effective interactive exploration of such traces. We focus on finding approaches and tools for "performance understanding", for example by identifying causal relationships between phenomena to explain the reasons of performance problems.
Tools
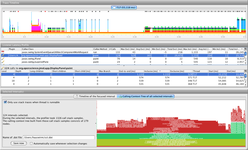
- LagAlyzer - Latency Trace Visualizer
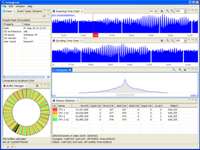
- TuningFork - Online Realtime Trace visualizer
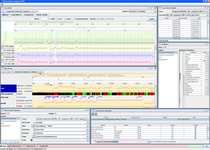
- Performance Explorer - Offline Performance Trace Visualizer
Publications
- ISPASS10. LagAlyzer: A latency profile analysis and visualization tool
- CC'06 demo. Demonstration: On-Line Visualization and Analysis of Real-Time Systems with TuningFork
- STMCS'06. Understanding Performance of Multi-Core Systems using Trace-Based Visualization
- EMSOFT'05. High-level real-time programming in Java
(TuningFork for online visualization of real-time VM/GC traces) - OOPSLA'04 demo. Performance explorer: understanding java application behavior
- PAC2'04. Performance and Environment Monitoring for Whole-System Characterization and Optimization
(Performance Explorer for offline visualization of PEM traces)
Publication Highlights
OOPSLA'15 - Use at Own Risk
PPPJ'13 - Jikes RVM Debugger
PLDI'12 - Algorithmic Profiling
OOPSLA'11 - Catch Me
ECOOP'11 - Beauty and Beast
PLDI'10 - Profiler (In)Accuracy
ASPLOS'09 - Measurement Bias
More...
Blast
Our framework for bytecode-level information-flow tracing of Java programs.

Jikes RDB
Working with the Jikes RVM? Use Jikes RDB for debugging your VM hacks.

Now built on top of LLDB, so it works on OS X and on Linux.