Interactive Episode
To characterize the perceptible performance of interactive applications, we measure the response time of user requests (episodes) by instrumenting the GUI toolkit's event dispatch code. The instrumentation measures the wall clock time it took the application to handle the request. As research in human computer interaction has found, requests that are shorter than a given threshold (around 100 ms) are not perceptible by the user. Requests longer than 100 ms are perceptible and can negatively affect user satisfaction and productivity. We thus collect a histogram of request lengths, which we represent as cumulative latency distribution plots.
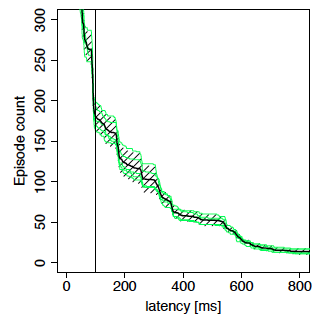
Figure 1: Cumulative Latency Distribution
Figure 1 shows an example of such a plot. The x-axis represents the latency in milliseconds. The y-axis shows the number of episodes that take longer than the given x ms. A vertical line at 100 ms represents the perceptibility threshold. Response times to the left of that line are not perceptible. An ideal curve would be L-shaped, where the vertical part of the L could lie anywhere between 0 and 100 ms, and the horizontal part should lie at 0, that is, there would be 0 episodes that took longer than 100 ms.
Given that it is impossible to accurately repeat the same user interaction multiple times with the exact same movements and timings, the cumulative latency distribution differs slightly between runs. Figure 1 shows multiple curves. The five thin lines represent the latency distributions for five runs of the same interactive session. The thick line represents the mean over these five distributions. Finally, the hatched pattern represents the confidence area for the mean. We computed the confidence area by computing a confidence interval for each point along the x-axis: e.g. we computed a 95% confidence interval for the five points at x = 400 ms, another one for the five points at x = 401 ms, and so on.
Publication Highlights
OOPSLA'15 - Use at Own Risk
PPPJ'13 - Jikes RVM Debugger
PLDI'12 - Algorithmic Profiling
OOPSLA'11 - Catch Me
ECOOP'11 - Beauty and Beast
PLDI'10 - Profiler (In)Accuracy
ASPLOS'09 - Measurement Bias
More...
Blast
Our framework for bytecode-level information-flow tracing of Java programs.

Jikes RDB
Working with the Jikes RVM? Use Jikes RDB for debugging your VM hacks.

Now built on top of LLDB, so it works on OS X and on Linux.