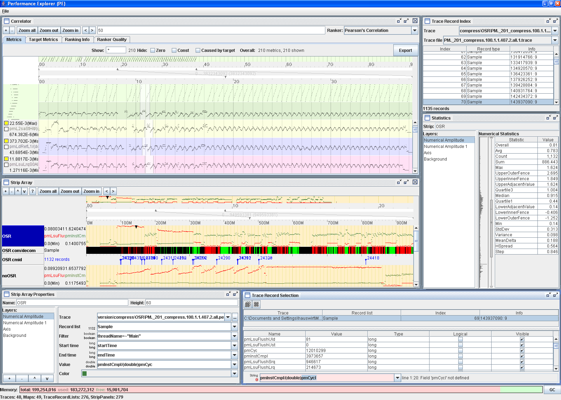
Performance Explorer - Offline Performance Trace Visualizer
Performance Explorer is an interactive tool for the offline visualization and analysis of traces of system performance.
We originally developed Performance Explorer (PE) as a tool to analyze the behavior of the Jikes Research Virtual Machine (Jikes RVM). We later turned into an Eclipse plug-in. PE was subsequently used for visualizing traces of IBM's Continuous Program Optimization (CPO) research team in their Performance and Environment Monitoring (PEM) infrastructure, and it was used to study the performance of multi-core systems based on traces instead of aggregate performance metrics.
PE uses a flexible binary trace file format and provides a computational engine implementing a Java-like expression language. A user can interactively build visualizations consisting of different basic building blocks. Each visualization can combine information from any number of traces.
Publications
- STMCS'06. Understanding Performance of Multi-Core Systems using Trace-Based Visualization
- PAC2'04. Performance and Environment Monitoring for Whole-System Characterization and Optimization
(visualization of PEM traces) - OOPSLA'04 demo. Performance explorer: understanding java application behavior
Read about our other research on Trace Visualization.
Publication Highlights
OOPSLA'15 - Use at Own Risk
PPPJ'13 - Jikes RVM Debugger
PLDI'12 - Algorithmic Profiling
OOPSLA'11 - Catch Me
ECOOP'11 - Beauty and Beast
PLDI'10 - Profiler (In)Accuracy
ASPLOS'09 - Measurement Bias
More...
Blast
Our framework for bytecode-level information-flow tracing of Java programs.

Jikes RDB
Working with the Jikes RVM? Use Jikes RDB for debugging your VM hacks.

Now built on top of LLDB, so it works on OS X and on Linux.