The Need for a Whole-System View of Performance
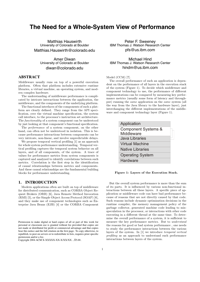
Middleware usually runs on top of a powerful execution platform. Often that platform includes extensive runtime libraries, a virtual machine, an operating system, and modern complex hardware.
The understanding of middleware performance is complicated by intricate interactions between the application, the middleware, and the components of the underlying platform.
The functional interfaces of the components of such a platform are clearly defined. They range from the API specification, over the virtual machine specification, the system call interface, to the processor’s instruction set architecture.
The functionality of a system component can be understood by just looking at that component’s functional specification.
The performance of a system component, on the other hand, can often not be understood in isolation. This is because performance interactions between components can be very intricate, non-linear, and involve unpredictable delays.
We propose temporal vertical profiling as an approach for whole system performance understanding. Temporal vertical profiling captures the temporal system behavior on all layers, and of all components, of the system. A trace of values for performance metrics from system components is captured and analyzed to identify correlations between such metrics. Correlation is the first step in the identification of causal relationships between metrics and components. And these causal relationships are the fundamental building blocks for performance understanding.
- Login to post comments


