ggplot2 Quick Reference: linetype
Geoms that draw lines have a "linetype" parameter.
Legal values are the strings "blank", "solid", "dashed", "dotted", "dotdash", "longdash", and "twodash". Alternatively, the numbers 0 to 6 can be used (0 for "blank", 1 for "solid", ...). Moreover, one can also use strings that define the linetype with up to 8 hexadecimal digits (each digit specifying the length of interleaved lines and gaps).
For most geoms, the default linetype is 1 (a solid line).
The linetype can be set to a constant value or it can be mapped via a scale.
Setting to constant value
To set the linetype to a constant value, use the linetype geom parameter (e.g., geom_line(data=d, mapping=aes(x=x, y=y), linetype=3) sets the linetype of all lines in the layer to 3, which corresponds to a dotted line).
Mapping via scale_linetype_discrete
The scale_linetype_discrete scale maps up to 12 distinct values to 12 pre-defined linetypes.
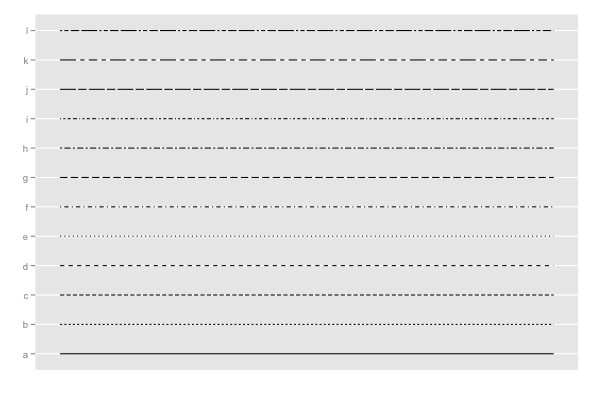
d=data.frame(a=c("a","b","c","d","e","f","g","h", "i", "j", "k", "l"))
ggplot() +
scale_x_continuous(limits=c(0,1), breaks=NA, name="") +
scale_y_discrete(name="") +
scale_linetype_discrete(legend=F) +
geom_segment(data=d, mapping=aes(x=0, xend=1, y=a, yend=a, linetype=a))
Mapping via scale_linetype_identity
The scale_linetype_identity scale can be used to pass through any legal linetype value (its mapping is the identity function, and thus it does not change anything).
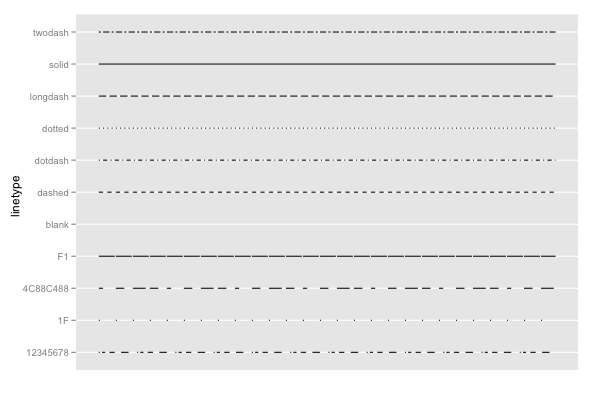
d=data.frame(lt=c("blank", "solid", "dashed", "dotted", "dotdash", "longdash", "twodash", "1F", "F1", "4C88C488", "12345678"))
ggplot() +
scale_x_continuous(name="", limits=c(0,1), breaks=NA) +
scale_y_discrete(name="linetype") +
scale_linetype_identity() +
geom_segment(data=d, mapping=aes(x=0, xend=1, y=lt, yend=lt, linetype=lt))
Note
The ggplot2 linetype parameter corresponds to the lty parameter of the R base graphics package (see the "lty" description on the help page of the par() function).
Publication Highlights
OOPSLA'15 - Use at Own Risk
PPPJ'13 - Jikes RVM Debugger
PLDI'12 - Algorithmic Profiling
OOPSLA'11 - Catch Me
ECOOP'11 - Beauty and Beast
PLDI'10 - Profiler (In)Accuracy
ASPLOS'09 - Measurement Bias
More...
Blast
Our framework for bytecode-level information-flow tracing of Java programs.

Jikes RDB
Working with the Jikes RVM? Use Jikes RDB for debugging your VM hacks.

Now built on top of LLDB, so it works on OS X and on Linux.