ggplot2 Quick Reference: shape
Geoms that draw points have a "shape" parameter.
Legal shape values are the numbers 0 to 25, and the numbers 32 to 127. Only shapes 21 to 25 are filled (and thus are affected by the fill color), the rest are just drawn in the outline color. Shapes 32 to 127 correspond to the corresponding ASCII characters.
For most geoms, the default shape is 16 (a dot).
The shape can be set to a constant value or it can be mapped via a scale.
Setting to constant value
To set the shape to a constant value, use the shape geom parameter (e.g., geom_point(data=d, mapping=aes(x=x, y=y), shape=3) sets the shape of all points in the layer to 3, which corresponds to a "+").
Mapping with scale_shape_discrete
The scale_shape_discrete scale maps up to 6 distinct values to 6 pre-defined shapes.
The scale has a boolean option, "solid", which determines whether the pre-defined set of shapes contains some solid shapes. If solid is set to T, the first three shapes are solid (but the fourth to sixth shape are hollow). Note that even though the first three shapes are solid, these three shapes are not actually filled with the fill color (but they are completely drawn in the outline color).

d=data.frame(a=c("a","b","c","d","e","f"))
ggplot() +
scale_x_discrete(name="") +
scale_y_continuous(limits=c(0,1), breaks=NA, name="") +
scale_shape_discrete(solid=T, legend=F) +
geom_point(data=d, mapping=aes(x=a, y=0.5, shape=a), size=10)
If solid is set to F, the first three shapes are hollow.
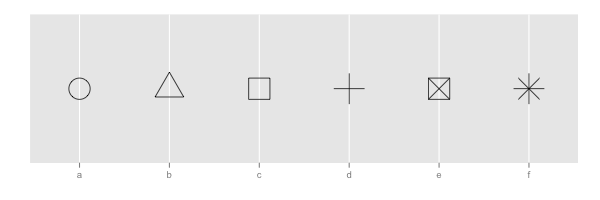
d=data.frame(a=c("a","b","c","d","e","f"))
ggplot() +
scale_x_discrete(name="") +
scale_y_continuous(limits=c(0,1), breaks=NA, name="") +
scale_shape_discrete(solid=F, legend=F) +
geom_point(data=d, mapping=aes(x=a, y=0.5, shape=a), size=10)
Mapping with scale_shape_identity
The scale_shape_identity scale can be used to pass through any legal shape value (its mapping is the identity function, and thus it does not change anything).

d=data.frame(p=c(0:25,32:127))
ggplot() +
scale_y_continuous(name="") +
scale_x_continuous(name="") +
scale_shape_identity() +
geom_point(data=d, mapping=aes(x=p%%16, y=p%/%16, shape=p), size=5, fill="red") +
geom_text(data=d, mapping=aes(x=p%%16, y=p%/%16+0.25, label=p), size=3)
Note
The ggplot2 shape parameter corresponds to the pch parameter of the R base graphics package (see the "pch" description on the help page of the points() function).
Publication Highlights
OOPSLA'15 - Use at Own Risk
PPPJ'13 - Jikes RVM Debugger
PLDI'12 - Algorithmic Profiling
OOPSLA'11 - Catch Me
ECOOP'11 - Beauty and Beast
PLDI'10 - Profiler (In)Accuracy
ASPLOS'09 - Measurement Bias
More...
Blast
Our framework for bytecode-level information-flow tracing of Java programs.

Jikes RDB
Working with the Jikes RVM? Use Jikes RDB for debugging your VM hacks.

Now built on top of LLDB, so it works on OS X and on Linux.