ggplot2 Quick Reference: size
Most geoms have a "size" parameter. For points, the size corresponds to their diameter. For lines, the size corresponds to their width. For text, the size corresponds to the height of their font.
Legal size values are any numbers greater than or equal to 0. For most geoms, the default size is 0.5.
The size can be set to a constant value or it can be mapped via a scale.
Setting to constant value
To set the size to a constant value, use the size geom parameter (e.g., geom_point(data=d, mapping=aes(x=x, y=y), size=5) sets the size of all points in the layer to 5.
Mapping with scale_size_identity
The scale_size_identity scale can be used to pass through any legal size value (its mapping is the identity function, and thus it does not change anything).
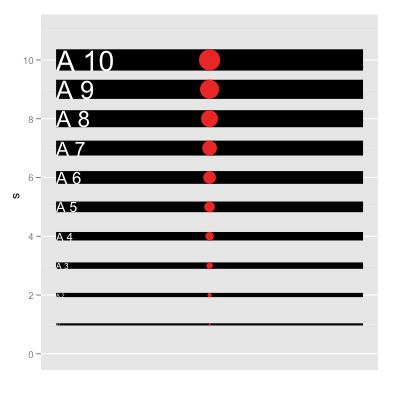
d=data.frame(s=0:10)
ggplot(data=d) +
scale_x_continuous(name="", limits=c(-1,1), breaks=NA) +
scale_y_continuous(limits=c(0,11)) +
scale_size_identity() +
geom_segment(mapping=aes(x=-1, y=s, xend=1, yend=s, size=s))+
geom_point(mapping=aes(x=0, y=s, size=s), color="red")+
geom_text(mapping=aes(x=-1, y=s, label=paste("A", s), size=s), hjust=0, color="white")
Note
The size does not relate to the coordinate system or the position scales of the plot in any way! The size (when using an identity scale or when setting it directly) is an absolute measure. A size of 1 corresponds to approximately 0.75 mm (or a font size of 3.75).
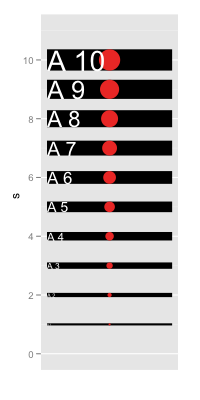
When rendering to bitmaps, the size in number of pixels thus depends on the resolution (e.g., png(..., res=72)) of the output device (the PNG device uses 72 pixels per inch, the resolution of an old-fashioned computer screen, as its default resolution).
In the example below, the left bitmap was created with png(..., width=200, height=400, res=72), the right bitmap with png(..., width=100, height=200, res=36) and zoomed in HTML (so the second one has the same size, but only half the resolution, on the screen).

Publication Highlights
OOPSLA'15 - Use at Own Risk
PPPJ'13 - Jikes RVM Debugger
PLDI'12 - Algorithmic Profiling
OOPSLA'11 - Catch Me
ECOOP'11 - Beauty and Beast
PLDI'10 - Profiler (In)Accuracy
ASPLOS'09 - Measurement Bias
More...
Blast
Our framework for bytecode-level information-flow tracing of Java programs.

Jikes RDB
Working with the Jikes RVM? Use Jikes RDB for debugging your VM hacks.

Now built on top of LLDB, so it works on OS X and on Linux.