ggplot2 Quick Reference: geom_abline
A geom that draws a line defined by slope and y-axis intercept.
Default statistic: stat_abline
Default position adjustment: position_identity
Parameters
For geom_abline, whether or not one uses the default statistic (stat_abline) or the "do nothing" statistic (stat_identity), the available parameters and their meanings stay the same.
- slope - (required) slope of the line (the "a" in "y=ax+b")
- intercept - (required) intercept with the y axis of the line (the "b" in "y=ax+b")
- size - (default: 0.5) width of the line
- linetype - (default: 1=solid) the type of the line
- colour - (default: "black") the color of the line
- alpha - (default: 1=opaque) the transparency of the line
Example
This example is slightly unrealistic, because the plot just contains an abline layer, without any other layers. Usually, geom_abline() is used to add a line to data shown in other layers (e.g. with geom_point()). Because there are no x or y aesthetics in this plot, ggplot2 cannot automatically produce useful x and y scales, and we have to explicitly define the scales to specify their limits (scale_x_continuous(... limits=c(0,10)) and scale_y_continuous(... limits=c(0,30))). We use different line types for the three different lines. The linetype of each line is determined by the line's slope. Given that the linetype parameter expects a discrete variable, we convert the continuous data$s into a discrete factor (with factor(s)). Because ggplot2 would use "factor(s)" as the default name of the legend, we use scale_linetype(name="s") to set the legend's title to the more intuitive "s".
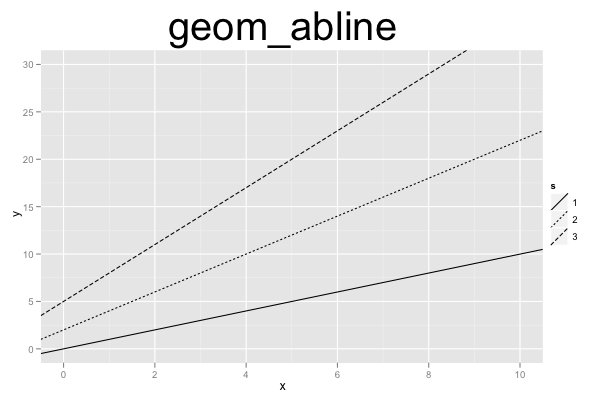
d=data.frame(s=c(1,2,3), ic=c(0,2,5))
ggplot() +
scale_x_continuous(name="x", limits=c(0,10)) +
scale_y_continuous(name="y", limits=c(0,30)) +
scale_linetype(name="s") +
geom_abline(data=d, mapping=aes(slope=s, intercept=ic, linetype=factor(s))) +
opts(title="geom_abline", plot.title=theme_text(size=40, vjust=1.5))
Publication Highlights
OOPSLA'15 - Use at Own Risk
PPPJ'13 - Jikes RVM Debugger
PLDI'12 - Algorithmic Profiling
OOPSLA'11 - Catch Me
ECOOP'11 - Beauty and Beast
PLDI'10 - Profiler (In)Accuracy
ASPLOS'09 - Measurement Bias
More...
Blast
Our framework for bytecode-level information-flow tracing of Java programs.

Jikes RDB
Working with the Jikes RVM? Use Jikes RDB for debugging your VM hacks.

Now built on top of LLDB, so it works on OS X and on Linux.