ggplot2 Quick Reference: geom_rect
A geom that draws a rectangle.
Default statistic: stat_identity
Default position adjustment: position_identity
Parameters
- xmin - (required) left edge of rectangle
- xmax - (required) right edge of rectangle
- ymin - (required) bottom edge of rectangle
- ymax - (required) top edge of rectangle
- size - (default: 0.5) line width of the rectangle's outline
- linetype - (default: 1=solid) line type of the rectangle's outline
- color - (default: NA=no outline) color of the rectangle's outline
- fill - (default: "grey20") fill color of the rectangle
- alpha - (default: 1=opaque) transparency of the rectangle's fill
Example
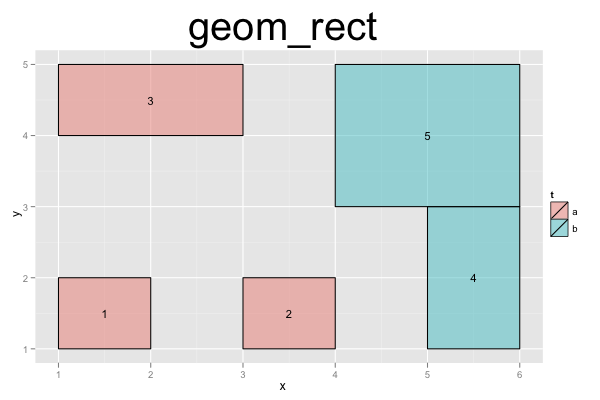
The following example shows how a data frame can define multiple rectangles. We add an extra layers to label each rectangle (with the observation number).

d=data.frame(x1=c(1,3,1,5,4), x2=c(2,4,3,6,6), y1=c(1,1,4,1,3), y2=c(2,2,5,3,5), t=c('a','a','a','b','b'), r=c(1,2,3,4,5))
ggplot() +
scale_x_continuous(name="x") +
scale_y_continuous(name="y") +
geom_rect(data=d, mapping=aes(xmin=x1, xmax=x2, ymin=y1, ymax=y2, fill=t), color="black", alpha=0.5) +
geom_text(data=d, aes(x=x1+(x2-x1)/2, y=y1+(y2-y1)/2, label=r), size=4) +
opts(title="geom_rect", plot.title=theme_text(size=40, vjust=1.5))


