ggplot2 Quick Reference: geom_step
A geom that draws a step-function, for example to visualize an empirical cumulative distribution function.
Default statistic: stat_identity
Default position adjustment: position_identity
Parameters
- group - (default: interaction of all categorical variables in the plot) how to group observations into step functions (each observation represents one step of a step function)
- x - (required) x-coordinate of the steps
- y - (required) y-coordinate of the steps
- direction - (default: "hv") of the steps ("hv" or "vh", showing the order of horizontal and vertical part of the step)
- size - (default: 0.5) line width of the step function's outline
- linetype - (default: 1=solid) line type of the step function's outline
- color - (default: "black") color of the step function's outline
- alpha - (default: 1=opaque) transparency of the polygon's fill
Example
The plot below consists of three layers. The first two layers draw a step-function, the last draws the corresponding points. The first step function is drawn with direction="hv" (the default; horizontal followed by vertical part of the step), the second step function (based on exactly the same data) is drawn with direction="vh" (vertical followed by horizontal part of the step), using a dotted line style.
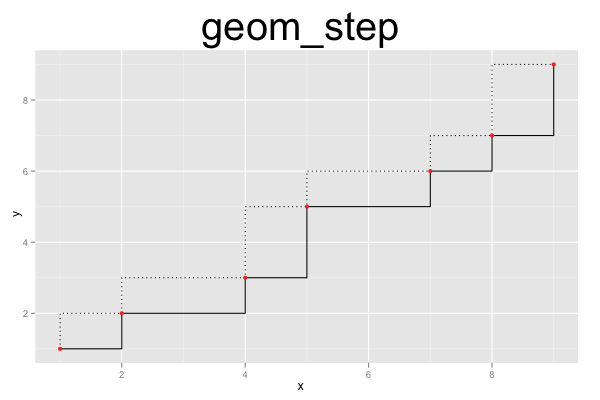
d=data.frame(x=c(1,2,4,5,7,8,9), y=c(1,2,3,5,6,7,9))
ggplot() +
geom_step(data=d, mapping=aes(x=x, y=y)) +
geom_step(data=d, mapping=aes(x=x, y=y), direction="vh", linetype=3) +
geom_point(data=d, mapping=aes(x=x, y=y), color="red") +
opts(title="geom_step", plot.title=theme_text(size=40, vjust=1.5))
Publication Highlights
OOPSLA'15 - Use at Own Risk
PPPJ'13 - Jikes RVM Debugger
PLDI'12 - Algorithmic Profiling
OOPSLA'11 - Catch Me
ECOOP'11 - Beauty and Beast
PLDI'10 - Profiler (In)Accuracy
ASPLOS'09 - Measurement Bias
More...
Blast
Our framework for bytecode-level information-flow tracing of Java programs.

Jikes RDB
Working with the Jikes RVM? Use Jikes RDB for debugging your VM hacks.

Now built on top of LLDB, so it works on OS X and on Linux.