ggplot2 Quick Reference: geom_point
A geom that draws a point defined by an x and y coordinate.
Default statistic: stat_identity
Default position adjustment: position_identity
Parameters
- x - (required) x coordinate of the point
- y - (required) y coordinate of the point
- size - (default: 0.5) diameter of the point
- shape - (default: 16=dot) the shape of the point
- colour - (default: "black") the color of the point
- fill - (default: NA) the fill of the point (only a small minority of shapes actually can be filled; see shape)
- alpha - (default: 1=opaque) the transparency of the point
- na.rm - (default: FALSE) silently remove points with NA coordinates
Example
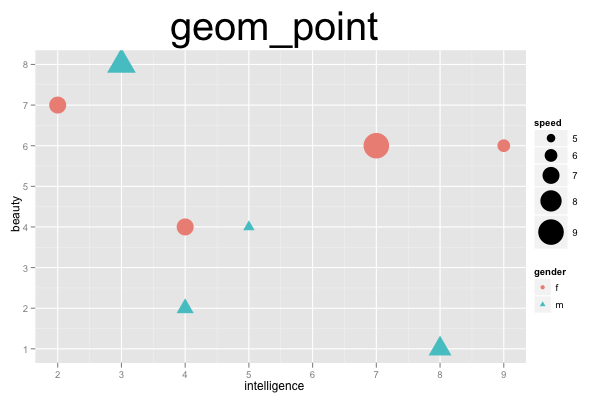
This example shows a scatterplot. It represents a rather common configuration (just a geom_point layer with use of some extra aesthetic parameters, such as size, shape, and color). The plot uses two aesthetic properties to represent the same aspect of the data (the gender column is mapped into a shape and into a color), which is possible but might be a bit overdone. The plot maps the continuous speed column onto the aesthetic size property. To ensure that even observations with a "low" speed are still mapped to rather large points, the plot explicitly uses scale_size_continuous to define the range of point sizes to use.

d=data.frame(beauty=c(1,2,6,4,4,6,7,8), intelligence=c(8,4,7,5,4,9,2,3), speed=c(7,6,9,5,7,6,7,8), gender=c('m','m','f','m','f','f','f','m'))
ggplot() +
scale_size_continuous(to=c(4,12)) +
geom_point(data=d, mapping=aes(x=intelligence, y=beauty, shape=gender, color=gender, size=speed)) +
opts(title="geom_point", plot.title=theme_text(size=40, vjust=1.5))


