ggplot2 Quick Reference: geom_hline
A geom that draws a horizontal line defined by an y-axis intercept.
Default statistic: stat_hline
Default position adjustment: position_identity
Parameters
For geom_hline, whether or not one uses the default statistic (stat_hline) or the "do nothing" statistic (stat_identity), the available parameters and their meanings stay the same.
- yintercept - (required) intercept with the y axis of the horizontal line
- size - (default: 0.5) width of the line
- linetype - (default: 1=solid) the type of the line
- colour - (default: "black") the color of the line
- alpha - (default: 1=opaque) the transparency of the line
Example
This plot consists of two layers. The bottom layer shows points, and the layer above it shows a red horizontal line. The line's yintercept is set to a constant value (which is the mean of the x values of all the points).
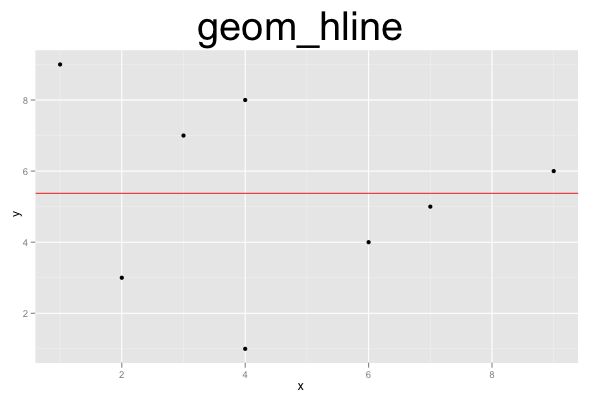
d=data.frame(x=c(1,2,3,4,4,6,7,9), y=c(9,3,7,1,8,4,5,6))
ggplot() +
geom_point(data=d, mapping=aes(x=x, y=y)) +
geom_hline(yintercept=mean(d$y), color="red") +
opts(title="geom_hline", plot.title=theme_text(size=40, vjust=1.5))
Publication Highlights
OOPSLA'15 - Use at Own Risk
PPPJ'13 - Jikes RVM Debugger
PLDI'12 - Algorithmic Profiling
OOPSLA'11 - Catch Me
ECOOP'11 - Beauty and Beast
PLDI'10 - Profiler (In)Accuracy
ASPLOS'09 - Measurement Bias
More...
Blast
Our framework for bytecode-level information-flow tracing of Java programs.

Jikes RDB
Working with the Jikes RVM? Use Jikes RDB for debugging your VM hacks.

Now built on top of LLDB, so it works on OS X and on Linux.