ggplot2 Quick Reference: geom_polygon
A geom that draws a polygon.
Default statistic: stat_identity
Default position adjustment: position_identity
Parameters
- group - (default: interaction of all categorical variables in the plot) how to group observations into polygons (each observation represents one point of a polygon)
- x - (required) x-coordinate of the polygon's points
- y - (required) y-coordinate of the polygon's points
- size - (default: 0.5) line width of the polygon's outline
- linetype - (default: 1=solid) line type of the polygon's outline
- color - (default: NA=no outline) color of the polygon's outline
- fill - (default: "grey20") fill color of the polygon
- alpha - (default: 1=opaque) transparency of the polygon's fill
Example
The following example shows how a data frame can define multiple polygons (in this example, two polygons). We add two extra layers to show the points (colored by polygon) and to label each point (with the observation=point number).
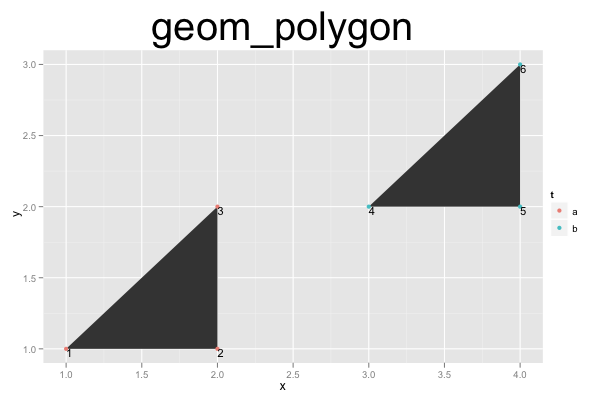
d=data.frame(x=c(1,2,2, 3,4,4), y=c(1,1,2, 2,2,3), t=c('a', 'a', 'a',  'b', 'b', 'b'), r=c(1,2,3, 4,5,6))
ggplot() +
geom_polygon(data=d, mapping=aes(x=x, y=y, group=t)) +
geom_point(data=d, aes(x=x, y=y, color=t)) +
geom_text(data=d, aes(x=x, y=y, label=r), hjust=0, vjust=1, size=4) +
opts(title="geom_polygon", plot.title=theme_text(size=40, vjust=1.5))
Publication Highlights
OOPSLA'15 - Use at Own Risk
PPPJ'13 - Jikes RVM Debugger
PLDI'12 - Algorithmic Profiling
OOPSLA'11 - Catch Me
ECOOP'11 - Beauty and Beast
PLDI'10 - Profiler (In)Accuracy
ASPLOS'09 - Measurement Bias
More...
Blast
Our framework for bytecode-level information-flow tracing of Java programs.

Jikes RDB
Working with the Jikes RVM? Use Jikes RDB for debugging your VM hacks.

Now built on top of LLDB, so it works on OS X and on Linux.