ggplot2 Quick Reference: geom_rect
A geom that draws a rectangle.
Default statistic: stat_identity
Default position adjustment: position_identity
Parameters
- xmin - (required) left edge of rectangle
- xmax - (required) right edge of rectangle
- ymin - (required) bottom edge of rectangle
- ymax - (required) top edge of rectangle
- size - (default: 0.5) line width of the rectangle's outline
- linetype - (default: 1=solid) line type of the rectangle's outline
- color - (default: NA=no outline) color of the rectangle's outline
- fill - (default: "grey20") fill color of the rectangle
- alpha - (default: 1=opaque) transparency of the rectangle's fill
Example
The following example shows how a data frame can define multiple rectangles. We add an extra layers to label each rectangle (with the observation number).
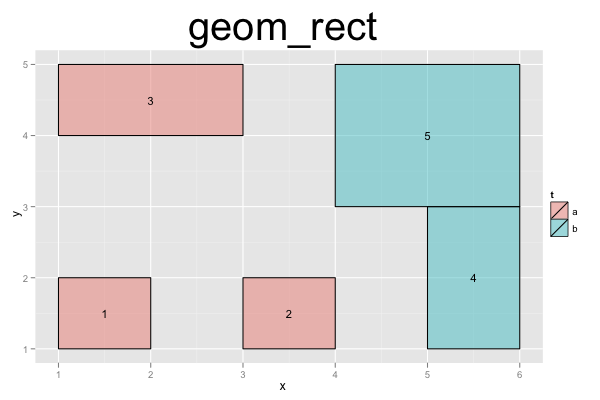
d=data.frame(x1=c(1,3,1,5,4), x2=c(2,4,3,6,6), y1=c(1,1,4,1,3), y2=c(2,2,5,3,5), t=c('a','a','a','b','b'), r=c(1,2,3,4,5))
ggplot() +
scale_x_continuous(name="x") +
scale_y_continuous(name="y") +
geom_rect(data=d, mapping=aes(xmin=x1, xmax=x2, ymin=y1, ymax=y2, fill=t), color="black", alpha=0.5) +
geom_text(data=d, aes(x=x1+(x2-x1)/2, y=y1+(y2-y1)/2, label=r), size=4) +
opts(title="geom_rect", plot.title=theme_text(size=40, vjust=1.5))
Publication Highlights
OOPSLA'15 - Use at Own Risk
PPPJ'13 - Jikes RVM Debugger
PLDI'12 - Algorithmic Profiling
OOPSLA'11 - Catch Me
ECOOP'11 - Beauty and Beast
PLDI'10 - Profiler (In)Accuracy
ASPLOS'09 - Measurement Bias
More...
Blast
Our framework for bytecode-level information-flow tracing of Java programs.

Jikes RDB
Working with the Jikes RVM? Use Jikes RDB for debugging your VM hacks.

Now built on top of LLDB, so it works on OS X and on Linux.