ggplot2 Quick Reference: geom_rug
A geom that draws a rug along the x and/or y axis.
Default statistic: stat_identity
Default position adjustment: position_identity
Parameters
- x - to draw a rug along the x-axis (one short line for each x value)
- y - to draw a rug along the y-axis (one short line for each y value)
- size - (default: 0.5) line width of the rug's lines
- linetype - (default: 1=solid) line type of the rug's lines
- color - (default: "black") color of the rug's lines
- alpha - (default: 1=opaque) transparency of the rug's lines
Note that x and y can be used at the same time to draw rugs along both axes.
Example
The following example plot contains three layers. The first layer contains a horizontal rug (in red), the second layer contains a vertical rug (in blue), and the third layer shows the underlying points. The two rugs could also be drawn in the same layer, but then the corresponding x and y lines would have to have the same color.
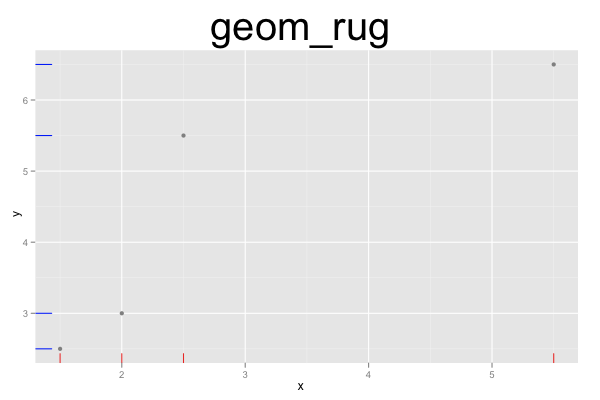
d=data.frame(x=c(1.5, 2, 5.5, 2.5), y=c(2.5, 3, 6.5, 5.5))
ggplot() +
geom_rug(data=d, mapping=aes(x=x), color="red") +
geom_rug(data=d, mapping=aes(y=y), color="blue") +
geom_point(data=d, mapping=aes(x=x, y=y), color="grey50") +
opts(title="geom_rug", plot.title=theme_text(size=40, vjust=1.5))
Publication Highlights
OOPSLA'15 - Use at Own Risk
PPPJ'13 - Jikes RVM Debugger
PLDI'12 - Algorithmic Profiling
OOPSLA'11 - Catch Me
ECOOP'11 - Beauty and Beast
PLDI'10 - Profiler (In)Accuracy
ASPLOS'09 - Measurement Bias
More...
Blast
Our framework for bytecode-level information-flow tracing of Java programs.

Jikes RDB
Working with the Jikes RVM? Use Jikes RDB for debugging your VM hacks.

Now built on top of LLDB, so it works on OS X and on Linux.