ggplot2 Quick Reference: geom_segment
A geom that draws a line segment defined by (x, y) and (xend, yend) coordinates.
Default statistic: stat_identity
Default position adjustment: position_identity
Parameters
- x - (required) x coordinate of starting point
- y - (required) y coordinate of starting point
- xend - (required) x coordinate of end point
- yend - (required) y coordinate of end point
- size - (default: 0.5) width of the line segment
- linetype - (default: 1=solid) the type of the line
- colour - (default: "black") the color of the line segment
- alpha - (default: 1=opaque) the transparency of the line segment
- arrow - (default: NULL) the arrow to draw at the end point of the line segment (use the
arrow()function in R'sgridpackage to create arrows)
Example
This plot contains two layers. The bottom layer draws the line segments, with solid blue lines of width 2 ending in an arrow. The upper geom_point layer draws points at the starting points of the line segments (filled in white, with a black outline).
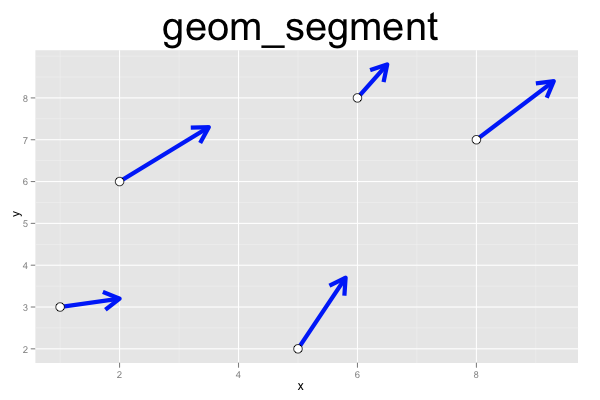
require(grid)
d=data.frame(x=c(1,2,5,6,8), y=c(3,6,2,8,7), vx=c(1,1.5,0.8,0.5,1.3), vy=c(0.2,1.3,1.7,0.8,1.4))
ggplot() +
geom_segment(data=d, mapping=aes(x=x, y=y, xend=x+vx, yend=y+vy), arrow=arrow(), size=2, color="blue") +
geom_point(data=d, mapping=aes(x=x, y=y), size=4, shape=21, fill="white") +
opts(title="geom_segment", plot.title=theme_text(size=40, vjust=1.5))
Publication Highlights
OOPSLA'15 - Use at Own Risk
PPPJ'13 - Jikes RVM Debugger
PLDI'12 - Algorithmic Profiling
OOPSLA'11 - Catch Me
ECOOP'11 - Beauty and Beast
PLDI'10 - Profiler (In)Accuracy
ASPLOS'09 - Measurement Bias
More...
Blast
Our framework for bytecode-level information-flow tracing of Java programs.

Jikes RDB
Working with the Jikes RVM? Use Jikes RDB for debugging your VM hacks.

Now built on top of LLDB, so it works on OS X and on Linux.