ggplot2 Quick Reference: geom_step
A geom that draws a step-function, for example to visualize an empirical cumulative distribution function.
Default statistic: stat_identity
Default position adjustment: position_identity
Parameters
- group - (default: interaction of all categorical variables in the plot) how to group observations into step functions (each observation represents one step of a step function)
- x - (required) x-coordinate of the steps
- y - (required) y-coordinate of the steps
- direction - (default: "hv") of the steps ("hv" or "vh", showing the order of horizontal and vertical part of the step)
- size - (default: 0.5) line width of the step function's outline
- linetype - (default: 1=solid) line type of the step function's outline
- color - (default: "black") color of the step function's outline
- alpha - (default: 1=opaque) transparency of the polygon's fill
Example
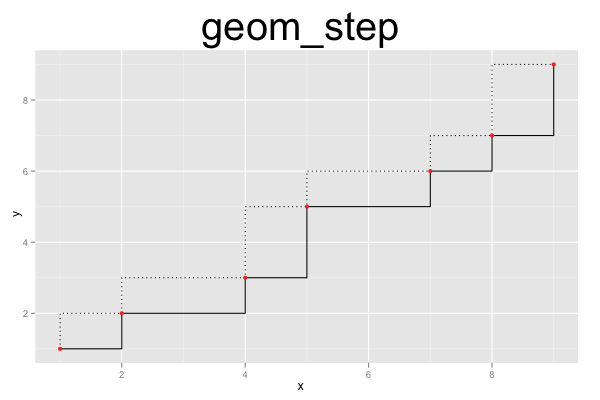
The plot below consists of three layers. The first two layers draw a step-function, the last draws the corresponding points. The first step function is drawn with direction="hv" (the default; horizontal followed by vertical part of the step), the second step function (based on exactly the same data) is drawn with direction="vh" (vertical followed by horizontal part of the step), using a dotted line style.

d=data.frame(x=c(1,2,4,5,7,8,9), y=c(1,2,3,5,6,7,9))
ggplot() +
geom_step(data=d, mapping=aes(x=x, y=y)) +
geom_step(data=d, mapping=aes(x=x, y=y), direction="vh", linetype=3) +
geom_point(data=d, mapping=aes(x=x, y=y), color="red") +
opts(title="geom_step", plot.title=theme_text(size=40, vjust=1.5))


