ggplot2 Quick Reference: geom_vline
A geom that draws a vertical line defined by an x-axis intercept.
Default statistic: stat_vline
Default position adjustment: position_identity
Parameters
For geom_vline, whether or not one uses the default statistic (stat_vline) or the "do nothing" statistic (stat_identity), the available parameters and their meanings stay the same.
- xintercept - (required) intercept with the x axis of the vertical line
- size - (default: 0.5) width of the line
- linetype - (default: 1=solid) the type of the line
- colour - (default: "black") the color of the line
- alpha - (default: 1=opaque) the transparency of the line
Example
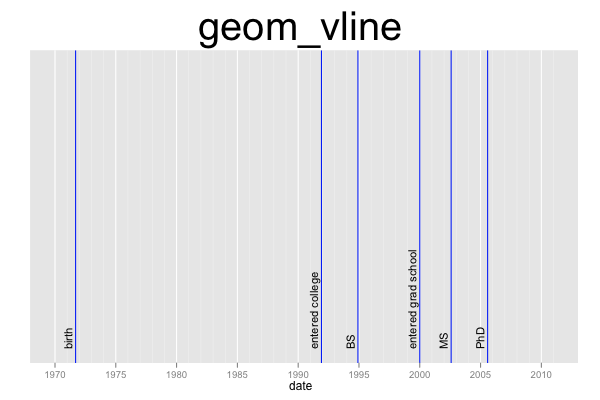
This plot consists of two layers. The bottom layer shows the vertical lines, and the layer above it shows text. The line's xintercept is set to the "date" column of the data frame. Thus, the plot contains one line for each row of the data frame. The plot uses a date scale on the x axis.

d=data.frame(date=as.Date(c("1971-09-01", "1991-12-01", "1994-12-01", "2000-01-01", "2002-08-01", "2005-08-01")), event=c("birth", "entered college", "BS", "entered grad school", "MS", "PhD"))
ggplot() +
scale_x_date(limits=as.Date(c("1970-1-1", "2010-12-31"))) +
scale_y_continuous(name="", breaks=NA, limits=c(0,1)) +
geom_vline(data=d, mapping=aes(xintercept=date), color="blue") +
geom_text(data=d, mapping=aes(x=date, y=0, label=event), size=4, angle=90, vjust=-0.4, hjust=0) +
opts(title="geom_vline", plot.title=theme_text(size=40, vjust=1.5))


